
Hitter Performance vs. Starting Pitchers and Relief Pitchers
Introduction
In school, there are some people who study around the clock for days or even weeks to prepare for an upcoming test. Others can cram for a little while before the test and figure out what each question is getting at on the spot.
On a typical day, MLB hitters have to be both of these types of student. Teams typically release their probable starting pitcher days in advance of a game. When a player shows up to the ballpark several hours before the game, he generally knows exactly who he will be going up against in his first few at bats. In fact, some MLB teams have invested in pitching machine technology like the Trajekt Arc that allows for hitters to basically take live at-bats off of the pitcher they expect to face. Combining this kind of technology with thorough scouting reports allows for hitters to be incredibly prepared for the other team’s starting pitcher.
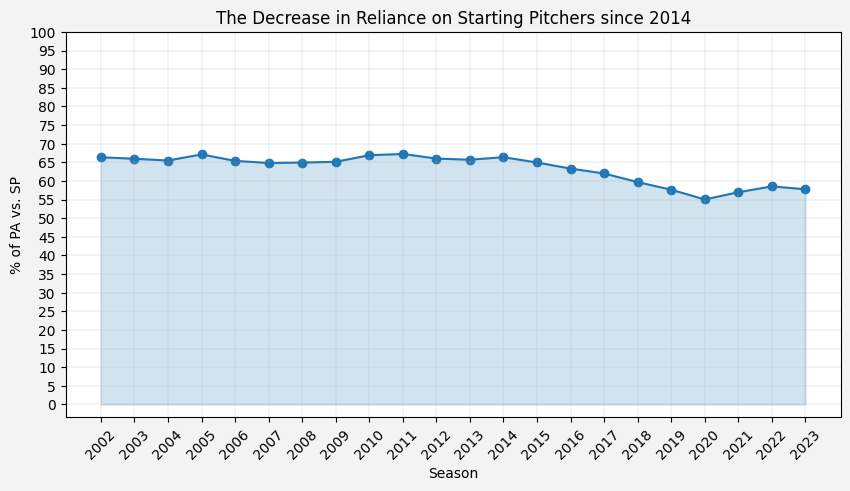
However, since 2014, there has been a notable decrease in reliance on starting pitchers to get through games. This transition can be attributed to a number of factors including the realization that pitchers become less effective each time they go through the batting order, likely due to a combination of fatigue, hitters’ abilities to adapt to what they are seeing and overall reliever effectiveness. While hitters are more equipped than ever to face starting pitchers, they are facing them less than they used to.
It is possible that some hitters prepare extensively for the relievers they might face, but there is often a quick cram session that occurs in the hitting team’s dugout when a new reliever jogs in from the bullpen and throws his warmup pitches. The most extensive studying is typically reserved for the probable starter.
Weighted Runs Created Plus (wRC+)
With these preparation differences in mind, I wanted to see which hitters performed better against starting pitchers and which performed better against relievers. I also wanted to know if hitters tend to reproduce this characteristic from season to season. To best evaluate overall hitter performance from year-to-year, wRC+ is a stat that makes a lot of sense. From Fangraphs’ wRC+ description:
While wOBA is a huge step forward from stats like batting average and slugging percentage, it doesn’t credit hitters who play in difficult parks or deduct points for hitters who play in smaller ones. wRC+ brings all the virtues of wOBA plus two added benefits; park and league adjustments.
The park factor helps to level the playing field so that a Rockies player (hitter-friendly home ballpark) can be usefully compared to a Mariners player (pitcher-friendly home ballpark). The league adjustment helps when comparing players across different seasons or even generations despite that their offensive environments may differ greatly.
Long story short, wRC+ is a great way to compare and contrast hitter performance over multiple seasons. Here is an unofficial scale that can be used to interpret wRC+:
| Ratings | wRC+ |
|---|---|
| Excellent | 160 |
| Great | 140 |
| Above Average | 115 |
| Average | 100 |
| Below Average | 80 |
| Poor | 75 |
| Awful | 60 |
League-level Tendencies
In general, hitters have long been performing better against starting pitchers than relievers. The Covid-shortened 2020 season was nearly an exception, but this difference in wRC+ between starters and relievers has been present in every other season since 2002.
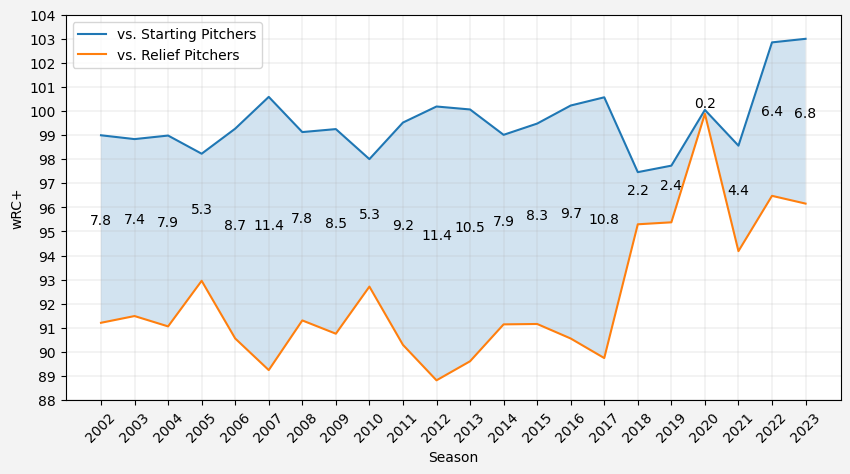
Nonetheless, plenty of hitters go against the norm and perform better against relievers than starters.
While there is an element of adaptability that comes with facing a reliever, I hesitate to label the calculation of wRC+ vs. SP - wRC+ vs. RP as “Prep Factor” or “Adaptability Factor” because I cannot say with certainty that this is the cause of the difference. Instead of assuming why a hitter performs differently versus starters and relievers, I just want to point out when there is or is not a performance difference and that the experience of facing a starter differs from facing a reliever.
Player-level Tendencies
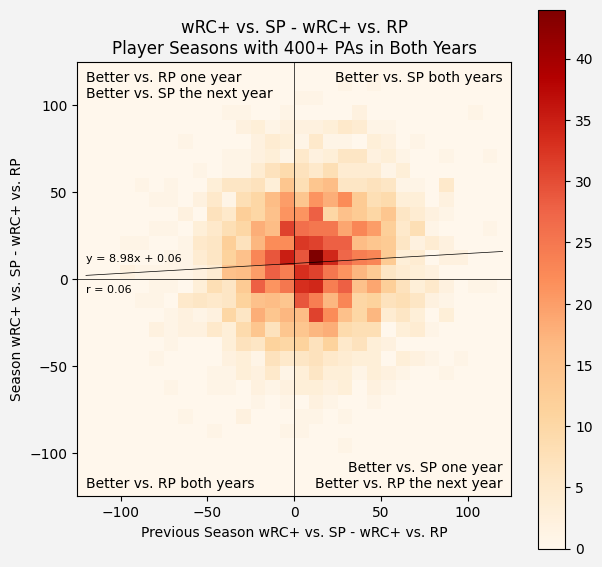
The following heatmap demonstrates the overarching theme that hitters tend to perform better against starting pitchers, but it also shows that we cannot always expect the same wRC+ vs. SP - wRC+ vs. RP performance from year to year for a player. For players who had 400+ PAs in each of 2 consecutive seasons, the correlation coefficient for their wRC+ vs. SP - wRC+ vs. RP metric from the first season to the second is only 0.06.
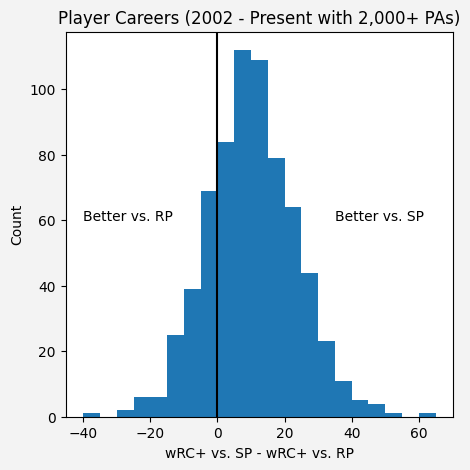
Viewing this data as histogram further demonstrates that there is substantial variance in a player’s wRC+ vs. SP - wRC+ vs. RP from one season to the next:
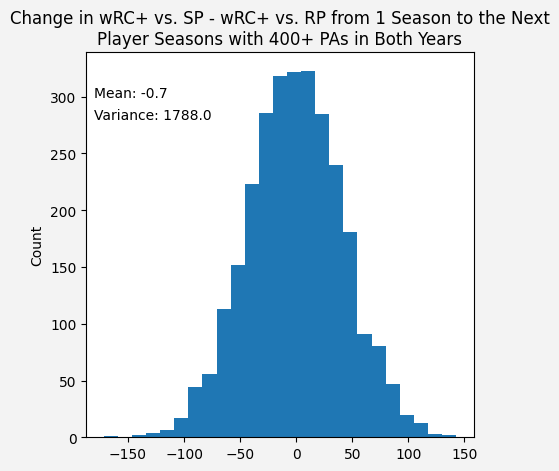
From these visuals, it seems unlikely that a player would consistently perform a certain way versus starting pitchers relative to how he performs against relief pitchers. However, there are going to be some players who are more consistent in this regard and others who will be completely unpredictable.
Most Consistent Performers
To measure the hitters’ consistency, I filtered out players who had less than 5 seasons of 400+ PAs. Then I took the players’ variance in wRC+ vs. SP - wRC+ vs. RP in their seasons of 400+ PAs.
Retired
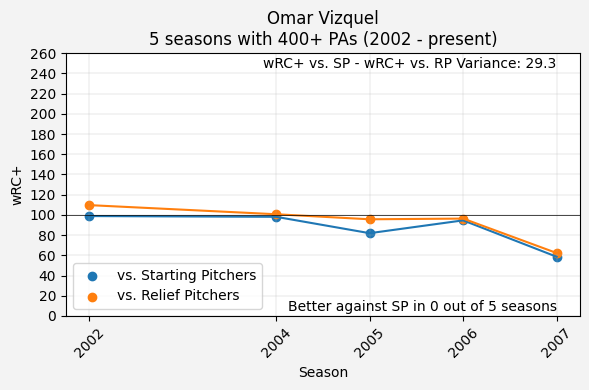
Defensive-minded shortstop Omar Vizquel displayed remarkable consistency from 2002 to 2007 in that his wRC+ against relievers was 0-15 points higher than his wRC+ against starters each year. It is worth noting that Vizquel played from 1989 to 2012 (24 seasons!), so this snippet from 2002 to 2007 may not be reflective of his whole career.
Active
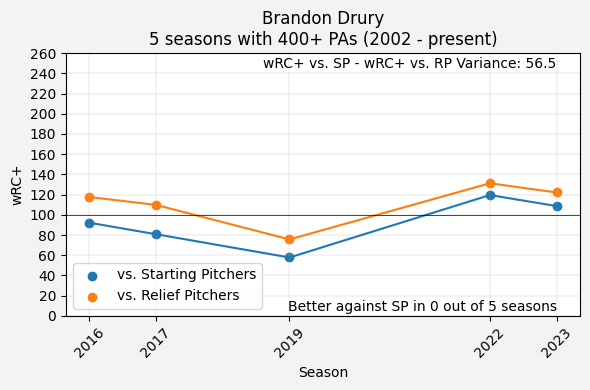
Similar to Vizquel, veteran third baseman Brandon Drury has consistently performed better versus relievers than starters over the course of his career. Drury’s wRC+ versus relievers has been 10-30 points higher than his wRC+ versus starters in all 5 of his seasons of 400+ PAs.
Least Consistent Performers
Retired
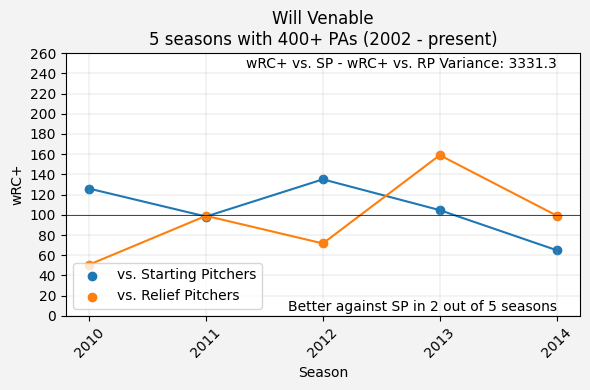
Texas Rangers’ Associate Manager Will Venable was anything but predictable from 2010 to 2014 when he was an outfielder for the San Diego Padres.
Active
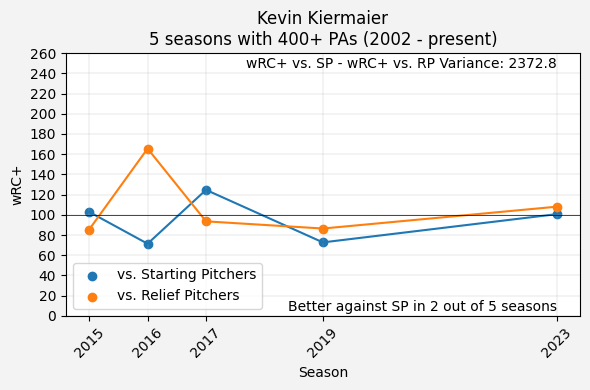
Kevin Kiermaier’s 2016 season was a wild outlier when he had a poor 71 wRC+ against starters and an outstanding 165 wRC+ versus relievers. Overall, he has had some seasons of preferring starters and others of performing better against relievers.
Notable Players
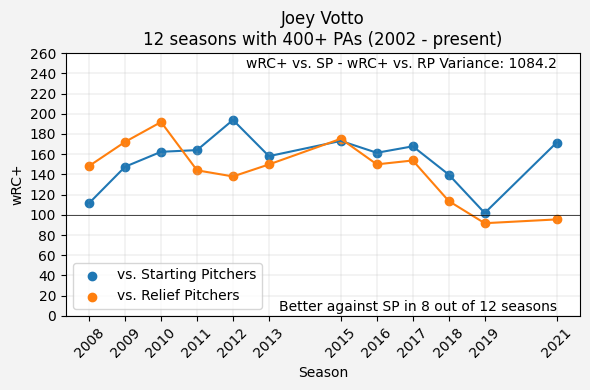
For fun, I wanted to see the same breakdown for a few household names.
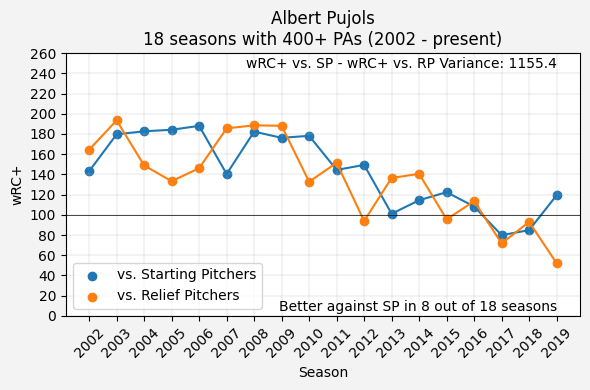
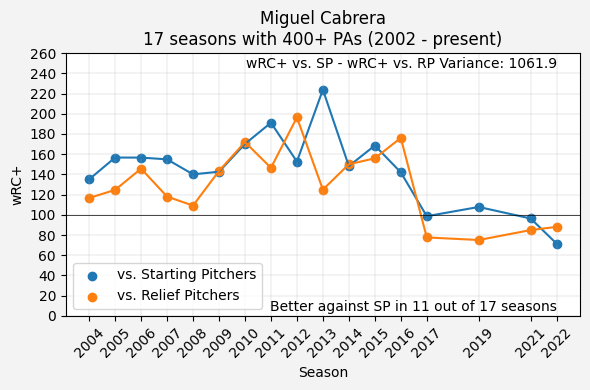
Retired
These 3 slugging legends seemed like hitting robots at times during their careers, but their performances versus starters and relievers actually varied quite a bit from year to year. One number that stands out is Miguel Cabrera’s 224 wRC+ vs. SP in 2013. Only Barry Bonds was able to exceed that number (2002 and 2004) in the seasons since 2002.
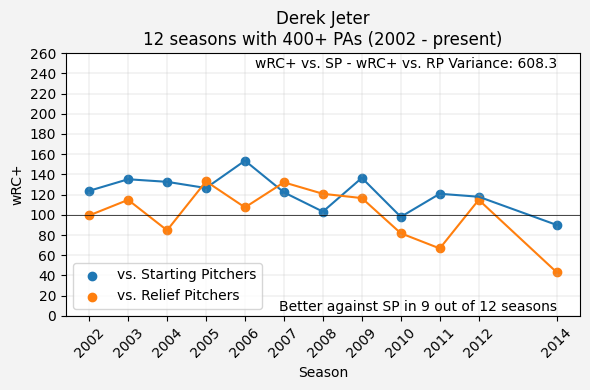
I had to include my personal favorite athlete of all time. Derek Jeter debuted in 1995, so this fails to capture the full extent of his career:
Active
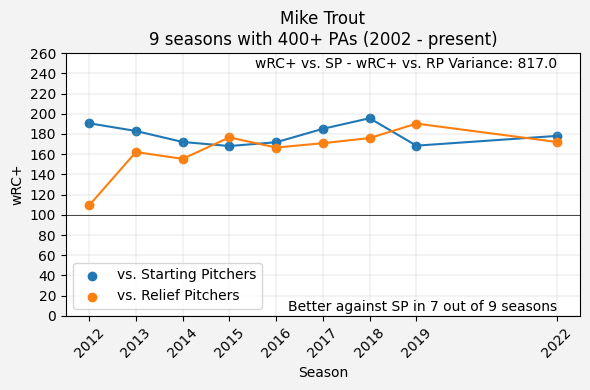
When Mike Trout has had healthy seasons with lots of plate appearances, he has dominated both starters and relievers. In his 2012 season in which he won the AL Rookie of the Year, he was more human against relief pitchers though.
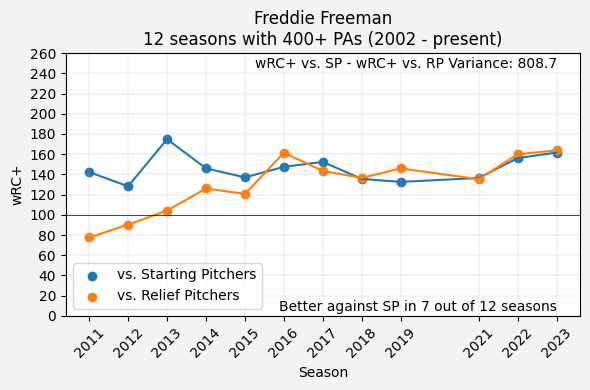
Once upon a time, Freddie Freeman was not so elite against relief pitching. From 2011-2015, he did most of his damage against starters but has been crushing all kinds of pitching since then.
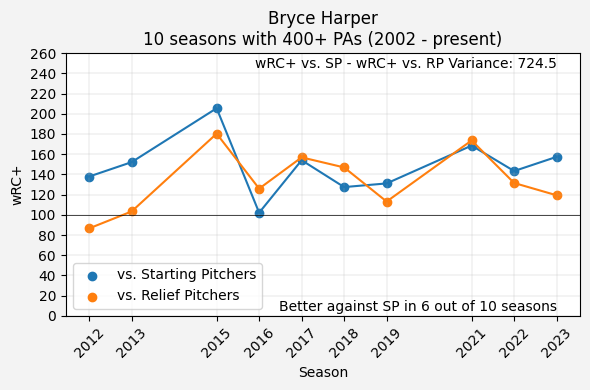
Bryce Harper has had lots of ups and downs over the course of his career (mostly ups though). His split numbers against starters and relievers tend to follow the trend of his overall performance:
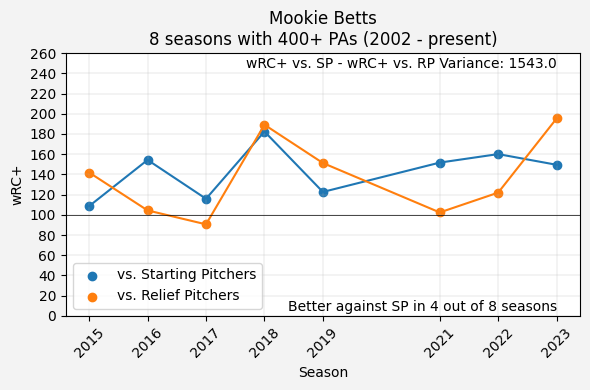
Mookie Betts is a strange case where, in a given season, he almost always performs way better against starters than relievers or vice versa. This led to a very high variance for him over his 8 seasons with 400+ PAs.
Conclusions
There are a number of possible reasons why hitters perform better overall against starting pitchers than relievers:
- Hitters can study and prepare more to face a known starting pitcher than they can for all of the possible arms that may come out of the bullpen.
- Starting pitchers usually hope to go 6+ innings or throw close to 100 pitches, so they may have to pace themselves and not throw each pitch at 100% max effort. Relievers can come in for an inning or so and throw around 10 to 20 max-effort pitches.
- Hitters typically get to face a starter more than once in a game. With each at bat, they get more tuned in to what the pitcher has in his arsenal and how he is trying to attack. For contrast, a reliever will rarely go through the lineup a second time.
Trying to group players as either intense preparers who perform better against starters or elite crammers/adapters who perform better against relievers is clearly difficult. 1,050 players had 400+ PAs in 5+ seasons from 2002 until now. Only 21 of these players (2%) were always better against starters or always better against relievers in those seasons:
| Player | Seasons w/ 400+ PA 2002 - Present |
% of Seasons Better vs. SP |
|---|---|---|
| Brian McCann | 11 | 100% |
| Alex Gonzalez | 8 | 100% |
| Jim Edmonds | 7 | 100% |
| Carlos Delgado | 7 | 100% |
| Pablo Sandoval | 7 | 100% |
| Freddy Sanchez | 6 | 100% |
| Clint Barmes | 6 | 100% |
| Delmon Young | 6 | 100% |
| Kyle Schwarber | 6 | 100% |
| Andrew Benintendi | 6 | 100% |
| Kenny Lofton | 5 | 100% |
| Sammy Sosa | 5 | 100% |
| Mark Grudzielanek | 5 | 100% |
| Ryan Klesko | 5 | 100% |
| Wilson Ramos | 5 | 100% |
| Grady Sizemore | 5 | 100% |
| Garrett Jones | 5 | 100% |
| Miguel Rojas | 5 | 100% |
| Omar Vizquel | 5 | 0% |
| Mark Loretta | 5 | 0% |
| Brandon Drury | 5 | 0% |
Four of these players are still playing. In 2024, it will be interesting to see if Kyle Schwarber, Andrew Benintendi and Miguel Rojas continue to hit better against starters and if Brandon Drury continues his consistent production against relievers.
Facing a starting pitcher and facing a relief pitcher are two different experiences, and this difference is going to matter more for some hitters than others. That being said, MLB hitters are elite professionals who have fine-tuned their craft over many years and prepare rigorously for their upcoming matchups.
Links
The data for this project is from Fangraphs’ Splits Leaderboards. Fangraphs is a phenomenal resource for students of baseball.
To see my code, check out the following notebook:
