
Expected Run Value
Introduction
Run Value is a way to translate the result of a pitch to an actual number of runs. Seeing that runs are the main currency in baseball games, this value is helpful for isolating the effect a player has on a game.
wOBA is one of the most popular ways to attach a single evaluative number to today’s MLB hitters. Unlike OBP, wOBA recognizes that doubles are more valuable than singles. Unlike SLG, wOBA recognizes that doubles are not exactly twice as valuable as singles. Instead, it weighs each at bat’s outcome in terms of how many runs that outcome is good for, on average. The stat takes the situations out of baseball so that hitters are not rewarded or punished for things they cannot control, like their teammates getting on base.
Statcast has blessed us with some incredible metrics to describe the action we see during MLB games. xwOBA takes wOBA a step further by measuring the predicted wOBA based solely off of the velocity and angle of the ball off the bat and the batter’s sprint speed. If a player’s wOBA is less than his xwOBA, this suggests that he has been somewhat unlucky and that his results should have been better than they were. The opposite goes for when wOBA exceeds xwOBA. In summary, xwOBA is possibly the best metric to determine the quality of contact. Deep line drives have a high xwOBA, and weak grounders have a low xwOBA.
Naturally, Run Value and xwOBA can be used to evaluate both hitters and pitchers. While hitters seek to generate runs and square up the baseball, pitchers try to prevent runs and miss barrels. While these two stats are useful, xwOBA ignores the importance of situational baseball on run scoring. Run Value does not accurately reflect the skill involved in a play. It even credits the batter if his teammate steals a base or punishes him if his teammate is caught stealing because these events happened during his at bat.
Take a look at these two clips with runners on second and third from the 2023 MLB season.
| Play Result | Exit Velocity | Launch Angle | xwOBA | Run Value |
|---|---|---|---|---|
| Line Out | 108.8 mph | 19° | 1.224 | -.379 |
| Play Result | Exit Velocity | Launch Angle | xwOBA | Run Value |
|---|---|---|---|---|
| Double | 71.6 mph | 38° | .401 | 1.336 |
The Casas play results in a very high xwOBA of 1.224, but Run Value says he costed his team .379 runs. Meanwhile, Ramirez posted a xwOBA of just .401 but generated 1.336 runs based on Run Value.
Now, check out these two frozen ropes Aaron Judge hit:
| Play Result | Exit Velocity | Launch Angle | xwOBA | Run Value |
|---|---|---|---|---|
| Solo Home Run | 111.4 mph | 22° | 1.813 | .975 |
| Play Result | Exit Velocity | Launch Angle | xwOBA | Run Value |
|---|---|---|---|---|
| Grand Slam | 110.0 mph | 22° | 1.753 | 3.043 |
In this scenario, we see how situations have a major effect on a player’s Run Value. Aaron Judge crushed both of these balls almost identically except one was slightly pulled whereas the other was right back up the middle. xwOBA does not consider horizontal launch angle, so these two swings have very similar xwOBA values. However, one was with the bases empty, and the other was with the bases loaded. The grand slam produced a much higher Run Value for Judge than the solo shot.
What these 4 clips tell us is that neither xwOBA nor Run Value perfectly describe what happens on a play. My goal is to measure how many runs a hitter generates or a pitcher prevents but removing factors that do not reflect their skill.
Expected Run Value
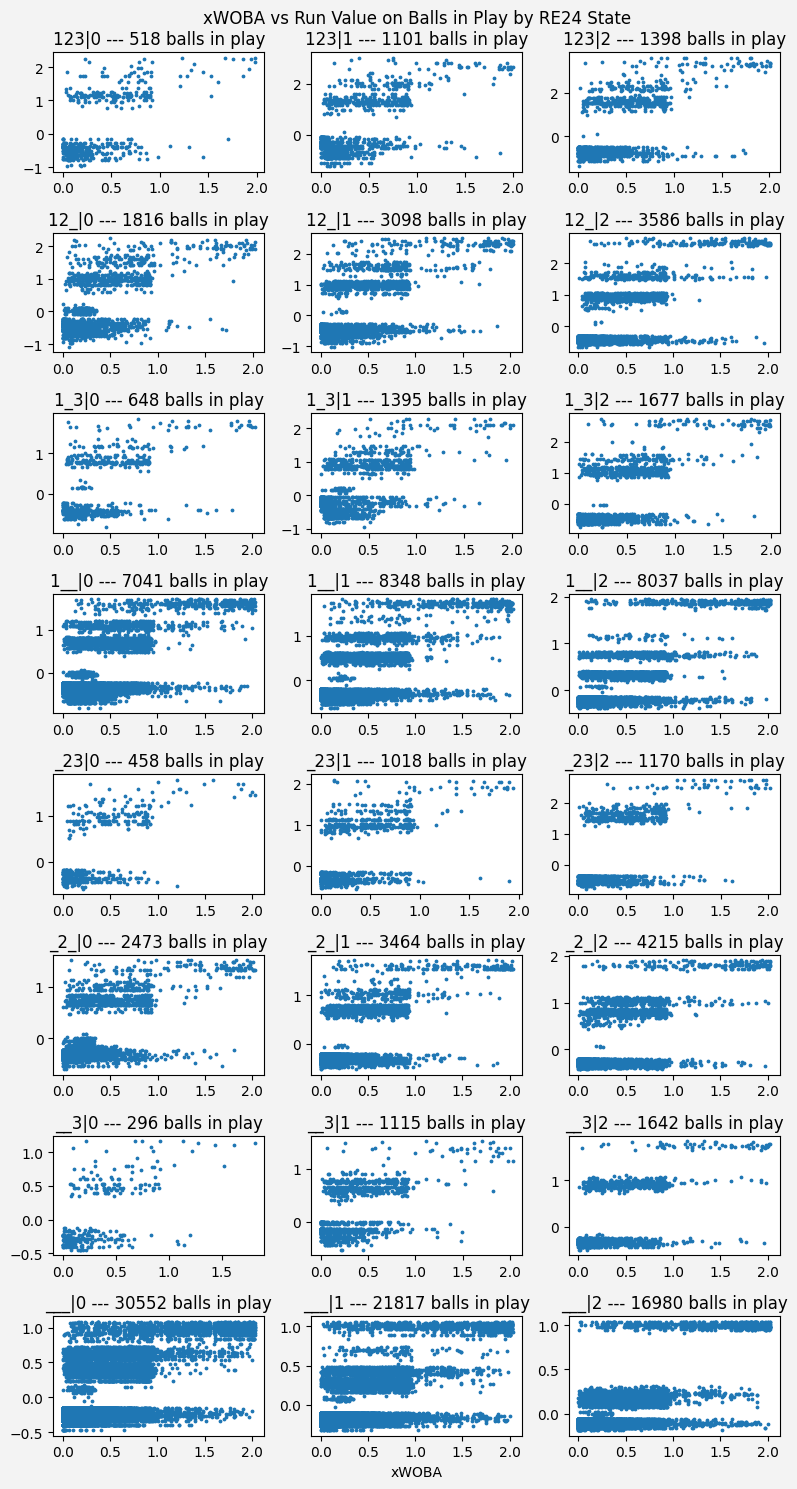
Similar to how xwOBA is an adjusted version of wOBA, I have constructed a statistic called Expected Run Value to modify a player’s Run Value based on the quality of his contact in any of the 24 baserunner/out scenarios (RE24 states). When MLB developed the xwOBA statistic, they went to great lengths to make it a metric that accurately evaluates the run-scoring capability of a ball in play. Read more about their process here. I am using this established metric to determine how “lucky” a player’s run value on a ball in play is based on the xwOBA. The relationship between xwOBA and Run Value is not particularly linear, even when grouped by RE24 state:
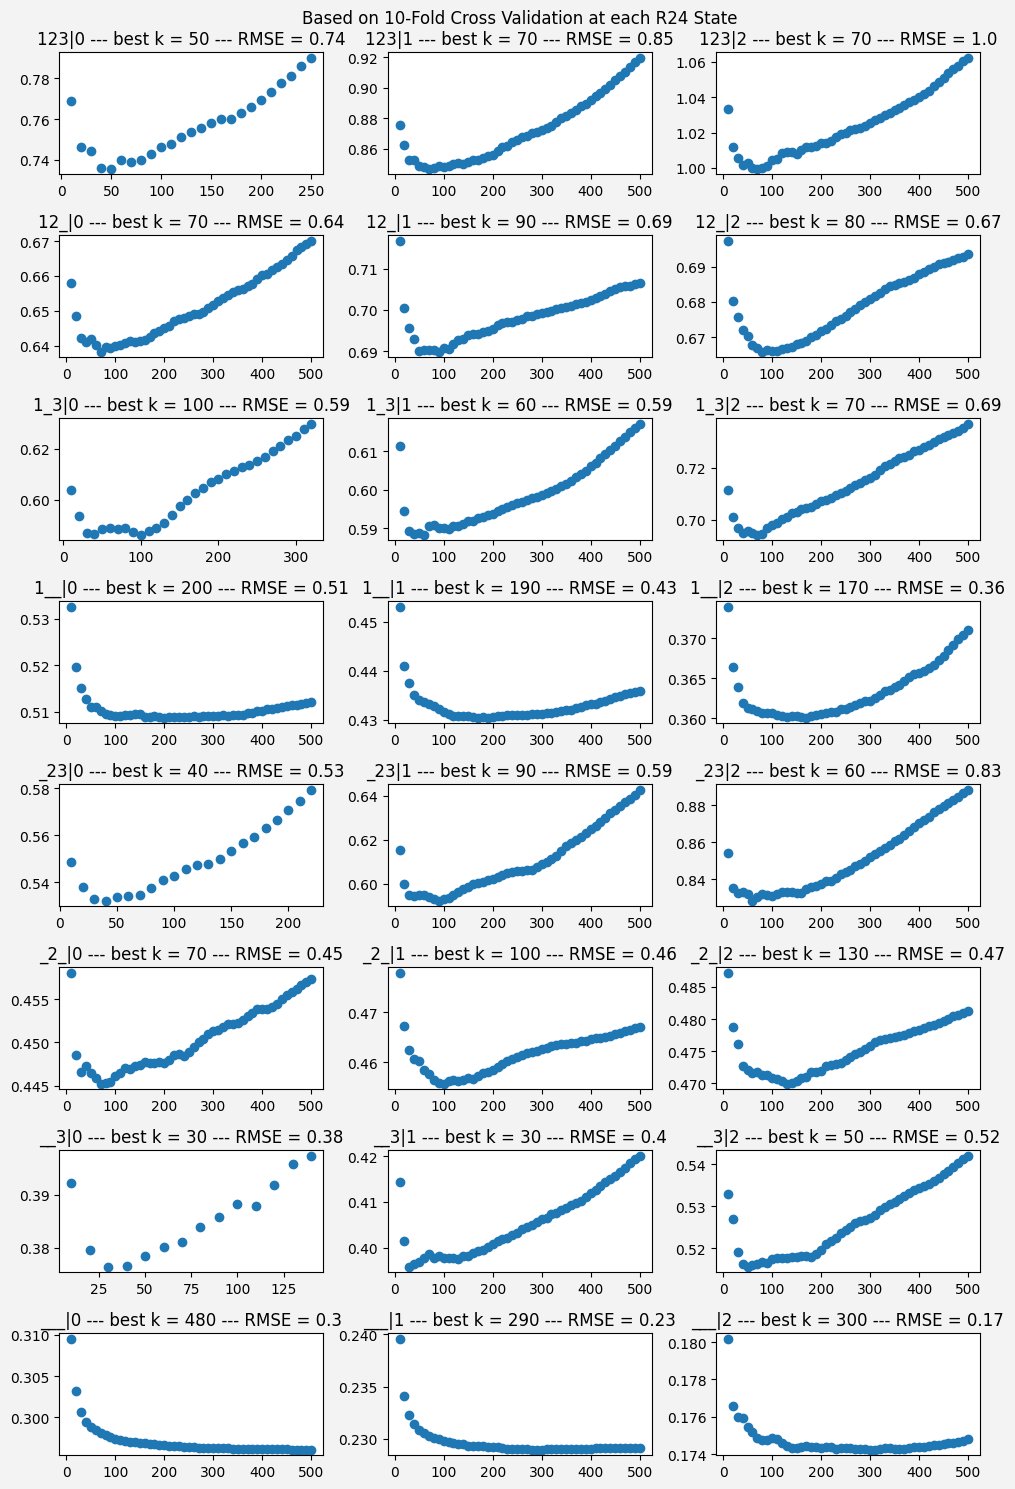
To find a solid non-linear predictor of Run Value, I turned to the K-nearest neighbors algorithm, which takes the average of the Run Values of the k most similar xwOBA values with the same RE24 state. I tried a number of different k values until I found the one that was most predictive of Run Value:
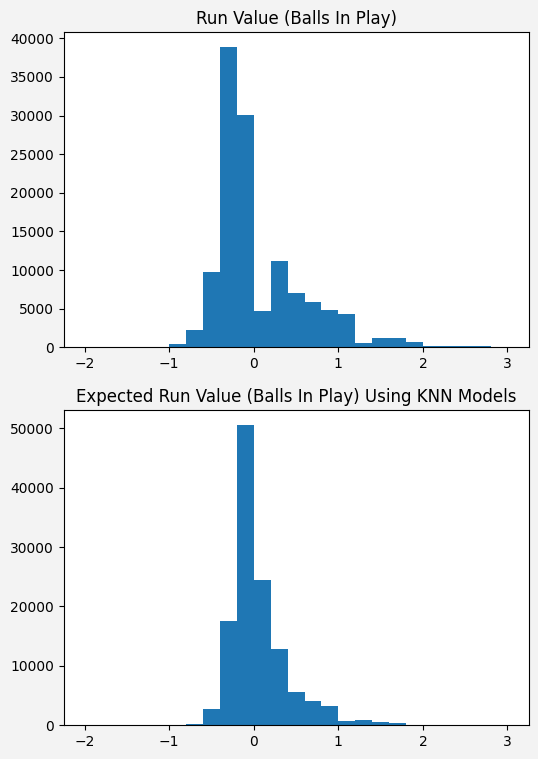
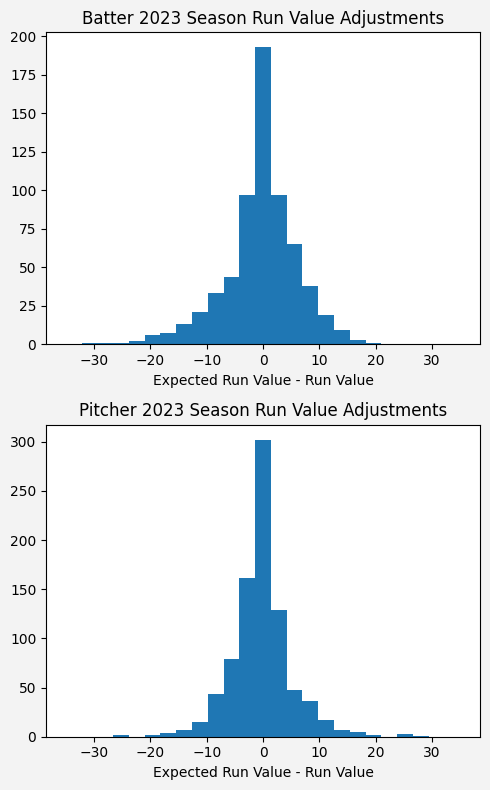
Naturally, balls in play with more extreme Run Values (think greater than 1.5 or less than -0.5) will generally have less extreme Expected Run Values. The following histograms show that Expected Run Value has a slightly more narrow distribution than Run Value:
Applying the Statistic
Now that I have a way of evaluating the number of runs that players “should have” generated on each batted ball, I want to apply the metric to 2023’s hitters and pitchers to see how it may cause us to rethink their performances.
When applying Expected Run Value to player seasons, most players’ Run Values are slightly adjusted (+/- 5 runs), but the following histograms show some extreme adjustments, too:
Next, I wanted to see which players were affected significantly by these adjustments.
Hitters by Expected Run Value
| Rank () | Player | Run Value | Exp. Run Value | +/- | |
|---|---|---|---|---|---|
| 1 |  |
Acuña Jr., Ronald | 66.6 | 80.9 | +14.3 |
| 2 ( 2) |  |
Betts, Mookie | 61 | 61.5 | +0.5 |
| 3 ( 5) |  |
Soto, Juan | 44.8 | 61.1 | +16.3 |
| 4 ( 2) |  |
Freeman, Freddie | 64.3 | 57.7 | -6.6 |
| 5 ( 2) |  |
Judge, Aaron | 45 | 56.2 | +11.2 |
| 6 |  |
Alvarez, Yordan | 48.7 | 54.9 | +6.2 |
| 7 ( 4) |  |
Tucker, Kyle | 41 | 51.4 | +10.4 |
| 8 ( 5) |  |
Olson, Matt | 63.6 | 48.4 | -15.2 |
| 9 ( 4) |  |
Ohtani, Shohei | 53.5 | 45.8 | -7.7 |
| 10 ( 1) |  |
Seager, Corey | 43.9 | 40.5 | -3.4 |
| … | … | … | … | … | … |
| 642 ( 45) |  |
Doyle, Brenton | -12.2 | -20.6 | -8.4 |
| 643 ( 5) |  |
Turang, Brice | -21.3 | -21.2 | +0.1 |
| 644 ( 16) |  |
Escobar, Eduardo | -16.5 | -21.5 | -5 |
| 645 ( 4) |  |
Maldonado, Martín | -26.4 | -21.8 | +4.6 |
| 646 ( 360) |  |
Ruiz, Esteury | -1.1 | -22.1 | -21 |
| 647 ( 53) |  |
Giménez, Andrés | -12 | -23.3 | -11.3 |
| 648 ( 3) |  |
Anderson, Tim | -30.2 | -23.6 | +6.6 |
| 649 ( 22) |  |
Wong, Connor | -16.2 | -24.2 | -8 |
| 650 ( 160) |  |
Merrifield, Whit | -6.1 | -28 | -21.9 |
| 651 ( 1) |  |
Straw, Myles | -29.6 | -28.4 | +1.2 |
Ronald Acuña Jr.’s MLB-best Run Value of 66.6 is further legitimized by his Expected Run Value of 80.9. In fact, his Expected Run Value is nearly 20 runs higher than the second highest, Mookie Betts’ 61.5! All of the top-10 performers here are highly regarded superstars, but I am surprised to see Whit Merrifield with the second-lowest Expected Run Value with -28. Merrifield was a solid contribitor to the Blue Jays’ offense this season but did have the fourth lowest average exit velocity of all qualified hitters in 2023.
Pitchers by Expected Run Value
Note: pitchers would desire a negative Run Value, as it would reflect run prevention.
| Rank () | Player | Run Value | Exp. Run Value | +/- | |
|---|---|---|---|---|---|
| 1 ( 15) |  |
López, Pablo | -21.6 | -38.9 | -17.3 |
| 2 ( 1) |  |
Cole, Gerrit | -44.6 | -27.8 | +16.8 |
| 3 ( 5) |  |
Bautista, Félix | -25.1 | -25.5 | -0.4 |
| 4 ( 44) |  |
Strider, Spencer | -15.3 | -25.1 | -9.8 |
| 5 ( 20) |  |
Steele, Justin | -18.5 | -23.9 | -5.4 |
| 6 ( 20) |  |
Eflin, Zach | -18.4 | -21.4 | -3 |
| 7 ( 1) |  |
Scott, Tanner | -25.1 | -20.8 | +4.3 |
| 8 ( 6) |  |
Snell, Blake | -43.8 | -19.9 | +23.9 |
| 9 ( 8) |  |
Verlander, Justin | -20.7 | -19.7 | +1 |
| 10 ( 9) |  |
Wheeler, Zack | -20 | -19.3 | +0.7 |
| … | … | … | … | … | |
| 854 ( 127) |  |
Ortiz, Luis L. | 7.2 | 20.6 | +13.4 |
| 855 ( 20) |  |
Syndergaard, Noah | 16.4 | 21.8 | +5.4 |
| 856 ( 5) |  |
Manoah, Alek | 20.7 | 22.9 | +2.2 |
| 857 |  |
Flexen, Chris | 28.5 | 23.4 | -5.1 |
| 858 ( 114) |  |
Megill, Tylor | 7.9 | 23.7 | +15.8 |
| 859 ( 6) |  |
Gomber, Austin | 22.9 | 25.3 | +2.4 |
| 860 ( 2) |  |
Muller, Kyle | 28.6 | 27.9 | -0.7 |
| 861 |  |
Lyles, Jordan | 31.1 | 29.2 | -1.9 |
| 862 ( 1) |  |
Wainwright, Adam | 36 | 36.4 | +0.4 |
| 863 ( 18) |  |
Corbin, Patrick | 19.7 | 45.3 | +25.6 |
The top 10 pitchers in regards to Expected Run Value were much more surprising than the hitters. Pablo Lopez is held in high regard right now due to his excellent postseason performance in 2023, but it turns out his regular season was every bit as impressive, as he had by far the highest Expected Run Value. It is also worth noting that relievers Felix Bautista and Tanner Scott are the only relievers who made the top 10. They were at a major disadvantage considering that Run Value is a counting stat, and relievers do not log as many innings as most starters.
Biggest Differences in Expected vs. Actual Run Value
Hitters
| Rank () | Player | Run Value | Exp. Run Value | +/- | |
|---|---|---|---|---|---|
| 17 ( 54) |  |
Guerrero Jr., Vladimir | 12.1 | 30.4 | +18.3 |
| 3 ( 5) | |
Soto, Juan | 44.8 | 61.1 | +16.3 |
| 24 ( 60) |  |
Soler, Jorge | 10.6 | 26.6 | +16 |
| 79 ( 402) |  |
Bell, Josh | -5.9 | 9.6 | +15.5 |
| 12 ( 28) |  |
Rutschman, Adley | 19.8 | 34.9 | +15.1 |
| 31 ( 83) |  |
Tatis Jr., Fernando | 7 | 22 | +15 |
| 33 ( 90) |  |
Ramírez, José | 6 | 20.5 | +14.5 |
| 111 ( 440) |  |
Bauers, Jake | -8.5 | 5.9 | +14.4 |
| 278 ( 344) |  |
Burleson, Alec | -15.3 | -1 | +14.3 |
| 135 ( 444) |  |
Kirk, Alejandro | -10.7 | 3.6 | +14.3 |
| … | … | … | … | … | |
| 149 ( 111) |  |
McLain, Matt | 20.8 | 2.5 | -18.3 |
| 499 ( 429) |  |
Ramírez, Harold | 12.2 | -6.3 | -18.5 |
| 116 ( 91) |  |
Altuve, Jose | 24.9 | 4.8 | -20.1 |
| 640 ( 443) |  |
Montero, Elehuris | 1.3 | -19.1 | -20.4 |
| 646 ( 360) | |
Ruiz, Esteury | -1.1 | -22.1 | -21 |
| 650 ( 160) | |
Merrifield, Whit | -6.1 | -28 | -21.9 |
| 86 ( 71) |  |
Carroll, Corbin | 31 | 8.2 | -22.8 |
| 274 ( 244) |  |
Bellinger, Cody | 22.9 | -0.9 | -23.8 |
| 372 ( 350) |  |
Paredes, Isaac | 25.4 | -2.9 | -28.3 |
| 595 ( 554) |  |
Friedl, TJ | 19.7 | -11.5 | -31.2 |
People were quick to criticize Vladimir Guerrero Jr.’s performance in 2023, but he did not get the results he deserved on batted balls. Several players also had outstanding Run Value seasons but had the benefit of good fortune along the way. Jose Altuve, NL Rookie of the Year Corbin Carroll and NL Comeback Player of the Year Cody Bellinger are among a list of star-studded players who rank in the bottom 10 in terms of Expected Run Value - Run Value.
Pitchers
| Rank () | Player | Run Value | Exp. Run Value | +/- | |
|---|---|---|---|---|---|
| 830 ( 786) |  |
Valdez, Framber | -15.8 | 12.7 | +28.5 |
| 863 ( 18) | |
Corbin, Patrick | 19.7 | 45.3 | +25.6 |
| 335 ( 329) |  |
Gallen, Zac | -26.1 | -1 | +25.1 |
| 8 ( 6) | |
Snell, Blake | -43.8 | -19.9 | +23.9 |
| 18 ( 15) |  |
Gray, Sonny | -38 | -17.7 | +20.3 |
| 81 ( 77) |  |
Senga, Kodai | -28.3 | -10 | +18.3 |
| 678 ( 621) |  |
Assad, Javier | -13.9 | 3.9 | +17.8 |
| 80 ( 75) |  |
Bradish, Kyle | -27.5 | -10.1 | +17.4 |
| 2 ( 1) | |
Cole, Gerrit | -44.6 | -27.8 | +16.8 |
| 721 ( 633) |  |
Garrett, Braxton | -11.3 | 5.1 | +16.4 |
| … | … | … | … | … | |
| 525 ( 308) |  |
Hill, Tim | 15.9 | 1.4 | -14.5 |
| 25 ( 313) |  |
Ryan, Joe | -0.8 | -16.1 | -15.3 |
| 46 ( 506) |  |
Nola, Aaron | 2.5 | -13.2 | -15.7 |
| 1 ( 15) | |
López, Pablo | -21.6 | -38.9 | -17.3 |
| 466 ( 376) |  |
Brown, Hunter | 18.2 | 0.7 | -17.5 |
| 290 ( 542) |  |
Pfaadt, Brandon | 15.8 | -1.8 | -17.6 |
| 804 ( 55) |  |
Severino, Luis | 28.9 | 9.4 | -19.5 |
| 117 ( 686) |  |
Smyly, Drew | 12.1 | -7.7 | -19.8 |
| 63 ( 751) |  |
Greene, Hunter | 13.1 | -11.4 | -24.5 |
| 799 ( 63) |  |
Seabold, Connor | 34.9 | 9.1 | -25.8 |
Framber Valdez, who had a lot of ups and downs in 2023, could have done a lot worse than his solid -15.8 Run Value. Hunter Greene’s Expected Run Value should provide optimism for Reds fans that he may get some better results going forward.
To view the data for every hitter and pitcher:
Google Sheet
Balls in Play: Biggest Differences in Expected vs. Actual Run Value
While Expected Run Value is useful for re-evaluating player seasons, it can also be applied to any individual batted ball. Here is the play that holds the greatest Expected Run Value - Run Value metric for the 2023 season:
| Play Result | xwOBA | Run Value | Expected Run Value | +/- |
|---|---|---|---|---|
| Fly Out | 1.488 | -.875 | 2.506 | +3.381 |
On the flip side, here is the lowest Expected Run Value - Run Value play for the 2023 season:
| Play Result | xwOBA | Run Value | Expected Run Value | +/- |
|---|---|---|---|---|
| Grand Slam | .091 | 3.353 | -.534 | -3.888 |
Conclusions
In player evalulation, there are no perfect stats to determine how well someone has performed. Run Value and xwOBA are both useful tools but do not paint the full picture. My Expected Run Value statistic attempts to use the positive characteristics of these two stats to counter each other’s weaknesses. My perception of many players’ 2023 seasons certainly changed when I saw their Expected Run Values. Ronald Acuña Jr. was at least as dominant as we all thought. Pablo Lopez should be viewed as a top-tier starting pitcher, not just an All-Star. NL Cy Young Winner Blake Snell and both All-Star starting pitchers (Cole and Gallen) were among the top 10 biggest drops from Run Value to Expected Run Value. They may have benefitted from good defense or well-positioned fielders.
In this study, I relied on K-Nearest Neighbors regression to determine the Expected Run Value of each play, but I would be interested in investigating other models in the future to make this statistic as useful as possible. We will see how 2024’s hitters and pitchers perform compared to their 2023 seasons.
Links
To see my code, check out the following notebook:
